
What you'll learn
In this guide you'll learn:
- How dashboards are organised in Expansive Insights
- The difference between Official and custom dashboards
- How to find the reports you need
- What Collections are and how they're used
- How to identify dashboards that have been customised for your organisation
Finding your way around
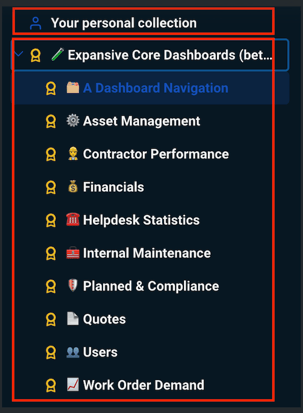
Expansive Insights is organised using Collections. Think of these as folders that group related dashboards and reports together, making it easier to find the information you're looking for.
Depending on your permissions, you'll typically have access to:
- Official dashboards maintained by Expansive
- Your organisation's own collection of dashboards
- Any reports you've created yourself (if applicable)
Official dashboards
Official dashboards are the standard reports created and maintained by Expansive.
They're designed to provide trusted, consistent reporting that works for all customers and are regularly reviewed and improved as the platform evolves.
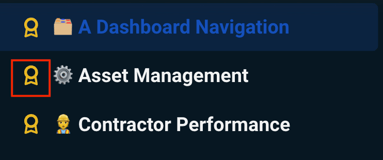
You'll recognise these dashboards by the Official badge displayed alongside their name.
Because these dashboards are centrally maintained, they can't be edited directly. If you'd like to customise one, you'll need to create a copy first, which we'll cover in a later guide.
💡 Best practice
Use Official dashboards as your starting point whenever possible. They contain the latest improvements and are designed to answer the most common operational and reporting questions.
Your organisation's dashboards
Alongside the Official dashboards, you'll also have access to your organisation's own collection.
This collection contains dashboards created specifically for your organisation, including:
- Bespoke operational reports
- Shared dashboards created by your team
- Customised versions of Official dashboards
- Reports built to support your own business processes
Unlike Official dashboards, these reports may vary between organisations and can evolve over time to meet your reporting needs.
Finding a dashboard
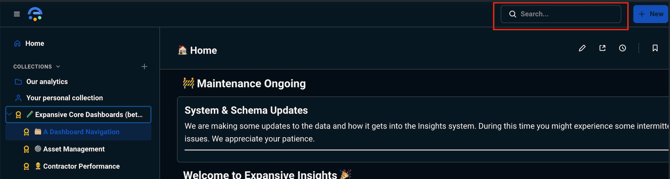
As your collection of reports grows, the quickest way to locate a dashboard is by using the search function.
You can search by:
- Dashboard name
- Keywords
- Report titles
If you're unsure which dashboard you need, start with one of the Official dashboards before exploring any organisation-specific reports.
Understanding dashboard layouts
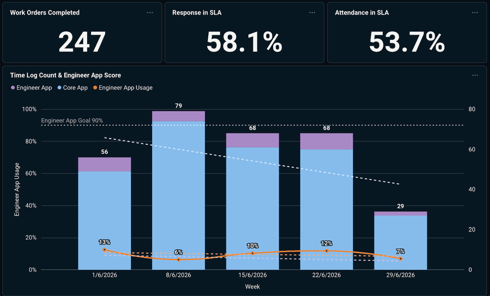
Although every dashboard is different, most follow a similar structure.
You'll usually find:
- Summary KPI cards showing key metrics at a glance
- Charts that highlight trends and performance over time
- Tables containing detailed operational information, and work order detail tables for investigating individual records
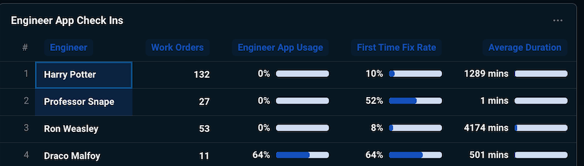
- Filters that allow you to focus on specific data
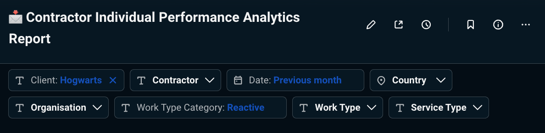
Each dashboard is designed to help answer a particular business question, whether that's monitoring contractor performance, reviewing compliance, tracking work order demand or understanding financial performance.
Dashboards are designed to be explored
Unlike a static report, dashboards in Expansive Insights are interactive.
As you explore a dashboard, you can:
- Apply filters to focus on the data you need
- Click charts to investigate trends
- Drill down into individual metrics using the tabs
- Explore the records behind charts and tables
This allows you to move from a high-level overview to the detailed information behind it without leaving the dashboard.
💡 Best practice
When investigating an issue, don't stop at the chart itself. Drill into the underlying data to understand what's driving the results. Here, you can select specific elements of charts, such as a bar in a bar chart, to be taken through to a page filtered by the element you interacted with.
Choosing the right dashboard
Each dashboard has been designed with a different reporting purpose in mind.
For example:
| Dashboard | Best used for |
|---|---|
| Work Order Demand | Understanding work volumes, trends and service demand |
| Open Work Orders | Monitoring outstanding work and operational backlogs |
| Compliance | Reviewing statutory and planned maintenance performance |
| Contractor Performance | Measuring contractor service levels and engineer activity |
| Financial Reporting | Understanding committed, accrued and actual spend |
We'll look at each of these in more detail in Understanding Your Standard Reports.
Things to watch out for
⚠️ Not every dashboard is editable
Official dashboards are read-only. If you'd like to make changes, create a copy and save it to an appropriate collection rather than attempting to replace the original.
⚠️ Different organisations may see different dashboards
The dashboards available to you depend on your organisation's configuration and your user permissions. If you can't see a dashboard you were expecting, contact your Insights administrator.
