
What you'll learn
In this guide you'll learn:
- How to use dashboard filters
- How date filters work
- How to filter by site, contractor and other fields
- When to use relative and fixed date ranges
- How Insights remembers your filters
- Best practices for getting accurate results
Why use filters?
Every dashboard in Expansive Insights is interactive.
Rather than creating a separate dashboard for every site, contractor or reporting period, you can use filters to focus on exactly the information you need.
For example, you could:
- View work orders for a single site
- Compare contractor performance
- Review last month's compliance
- Investigate emergency work orders
- Analyse a specific service type
Using filters allows you to answer these questions without changing the dashboard itself.
Where to find dashboard filters
Most dashboards include filters along the top of the page.
Depending on the dashboard you're viewing, these may include:
- Date range
- Site
- Site tag or region
- Contractor
- Service type
- Work order status
- Priority
- Work order type

Filtering by date
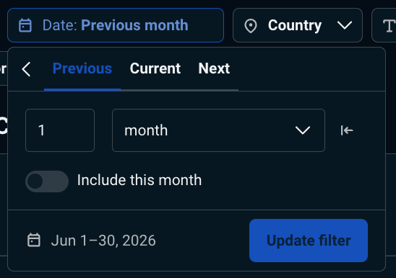
The date filter controls the reporting period shown throughout the dashboard.
Most dashboards default to showing data from the previous 30 days, but you can change this at any time.
Common options include:
- Today
- Yesterday
- Previous 7 Days
- Previous 30 Days
- Previous Month
- This Month
- Next 30 Days
- Custom Date Range
Simply select the date range you want, and every chart and table on the dashboard will update automatically.
Relative vs fixed dates
When choosing a date range, it's useful to understand the difference between relative and fixed dates.
Relative dates
Relative dates update automatically over time.
For example:
- Previous 30 Days
- Previous Month
- This Month
- Next 30 Days
These are ideal for dashboards you'll use regularly because you won't need to update the filters each time.
💡 Best practice
Use relative dates whenever possible, especially if you're creating dashboards or scheduling reports that you'll revisit regularly.
Fixed dates
Fixed dates use a specific start and end date.
For example:
- 1 January 2025 to 31 March 2025
These are useful when:
- Producing month-end reports
- Investigating a historical issue
- Comparing a specific reporting period
Using multiple filters
Filters can be combined to answer more detailed questions.
For example, you might choose:
- Previous Month
- Contractor = ABC Maintenance
- Priority = Emergency
- Site = Birmingham Distribution Centre
This narrows the dashboard to only the records matching all of those criteria.
Using multiple filters is one of the quickest ways to investigate operational issues without needing to create a new report.
Common filters explained
Site
Use this filter to focus on one or more locations.
This is particularly useful for organisations managing multiple sites.
Contractor
Review work completed by a specific contractor or supplier.
This can help monitor performance, workload and service delivery.
Service Type
Limit the dashboard to a particular maintenance discipline, such as:
- Electrical
- HVAC
- Fire Safety
- Security
The available service types will depend on your organisation's configuration.
Work Order Status
Focus on work orders at a particular stage, such as:
- Open
- In Progress
- Completed
- Abandoned
Priority
Review only work orders with a specific priority, such as Emergency, Urgent or Routine.
Your filters are remembered
Insights remembers the filters you've applied when you return to a dashboard.
This makes it easier to continue where you left off without reapplying the same filters each time.
If the information doesn't look as you expect when reopening a dashboard, check the filters first—they may still be using the selections from your previous session.
💡 Tip
If you're unsure why a dashboard looks different from a colleague's, compare your filter selections before investigating further.
💡 Tip
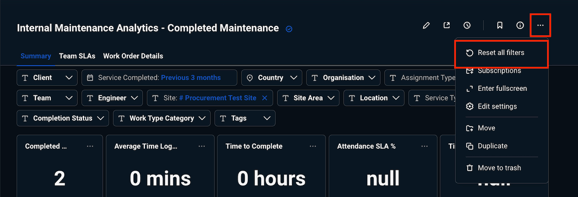
You can clear your dashboard filters by using the three dots and selecting reset all filters
Things to watch out for
⚠️ Some dashboards use different dates
Not every dashboard reports on the same date field.
For example, one report may use the Created Date, while another uses the Completed Date or Due Date, depending on what the dashboard is designed to measure. This helps ensure each report reflects the most meaningful point in the work order lifecycle.
⚠️ More filters don't always mean better insights
Applying too many filters can leave you with very little data, making trends harder to spot.
If a dashboard appears empty, try removing one or more filters to broaden your results.
⚠️ Exports use your current filters
If you export a dashboard or table, the exported data will reflect the filters you've applied.
Always double-check your filter selections before exporting or sharing reports.
Next steps
Now that you know how to filter your dashboards, you're ready to explore the data behind the charts.
Continue to Exploring Your Data to learn how to drill into charts, investigate work orders and answer operational questions in more detail.
Related articles
- Getting Started with Expansive Insights
- Navigating Dashboards
- Exploring Your Data
- Scheduling Reports
